IT helps researchers see their data like never before
Posted by Andrew Careaga
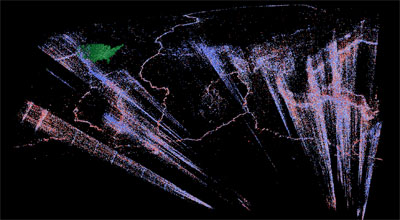
This screenshot from Missouri S&T’s 3-D visualization program V4DiR shows where earthquakes occurred — and how deep into the earth — during a certain time frame. Using V4DiR, S&T researchers can now visualize global earthquake data from 1920 through 2012.
Making sense of the ever-increasing mounds of data is one of the great challenges facing researchers today. At Missouri University of Science and Technology, staff and students in the information technology department have come up with an approach to help researchers gain a new perspective on their data.
The IT research support services (RSS) team at Missouri S&T has developed a tool to help researchers visualize their data. Called Visualizing Four Dimensions in Rolla, the system allows researchers to view their data in 3-D over various time spans.
The system is called V4DiR for short and is pronounced “Vader,” as in Darth. It holds promise for shedding light on various research projects at Missouri S&T and elsewhere, says RSS director Mark Bookout.
On campus, Bookout’s team has been demonstrating V4DiR’s power to researchers by showing maps-in-motion of natural disasters: all of the world’s earthquake occurrences from 1920 through 2012 as well as tornado activity in the U.S. since 1950. The earthquake data is also being used by Dr. Stephen Gao, a professor of geology and geophysics who is studying seismic activity in the Horn of Africa region.
The team also demonstrates V4DiR with a 3-D immersion of a New Mexico mine created by a remote-sensing technology known as LIDAR. With V4DiR it is possible to take a virtual walk-through of the mine, scanning the environment for anything that a researcher is looking for or that may seem out of place.
The RSS team uses projectors, head-mounted displays and a big-screen 3D TV to show off V4DiR’s capabilities. That on-screen visualization – a continuous loop of information – can be manipulated to help researchers home in on specific data points. For instance, the visualization can be tilted on an axis to provide greater levels of depth or various angles. It can also be stopped if researchers want to examine data from a particular time frame.
“We can pinpoint exactly where on the earth, as well as how deep within the earth, an earthquake has happened,” says Nick Eggleston, a junior computer science major from Maysville, Mo., who leads the project. Eggleston is part of a cadre of undergraduate students employed by RSS to develop tools that support Missouri S&T’s computing-intensive research efforts. He is developing a computer program to allow the software to show how data progresses over time. The program will also allow users to manipulate the format of their data and combine similar sets of data.
As impressive as the technology is in its ability to make images out of numbers, another aspect of V4DiR may be even more remarkable, says RSS director Bookout.
“One of the most powerful things to me is to watch how someone who sees it for the first time reacts to the visualization,” Bookout says. “Without exception, the first experience for faculty who see what we can do translates into a ‘Can it do this?’ conversation. Sometimes we hear, ‘I’ve never seen that before’ or even, ‘Uh-oh, what I thought was happening here in the data was wrong. I need to change something.’”
Bookout and undergraduate students demonstrated an earlier version of the system last November at Supercomputing 2012, an international conference for high-performance computing sponsored by the IEEE Computer Society and the Association for Computing Machinery. They plan to show off the system again at this year’s conference.
They also demonstrated V4DiR at the Great Plains Network conference last May in Kansas City, Mo. (S&T is a member of the Great Plains Network, a consortium of universities in the Midwest.) There, Eggleston met a behavioral psychologist who discussed the potential of using V4DiR to visualize data related to her research on how children with autism behave during various times of the day.
“V4DiR has the potential to enhance any sort of research,” Bookout says. “It allows us to use our natural pattern-recognition capabilities to isolate interesting groupings of information. And our association with vendors ensures that we have enough computing horsepower to build and display very large data sets in quick order.”
The RSS team also plans to demonstrate V4DiR on campus at this year’s Research Technology Day, to be held Sept. 9-10 at the Havener Center. The annual conference, now in its third year, is designed to showcase various technology used to support research at Missouri S&T and other campuses in the region.
Share this page
Posted by Andrew Careaga
Leave a Reply
 Sports Headlines
- Segrest Takes Helm of Track & Field Program
- Rizq Adam Rohizam Finishes 2nd at the Singapore Open Amateur Championship
- Ethan Hudson to Serve as S&T Football Assistant Coach for Linebackers
- Connor Benjamin Secures CSC Academic All-America; Third Straight for Men’s Golf Program
- Women's Soccer Adds Four More to 2025 Class
3D is a flagrantly misused encoding, especially for things like geospatial and abstract data. The only case mentioned in this article where it might be justified is in the case of mine exploration – and even that may not be appropriate. For an effective visualization, much depends on the scientists’ specific tasks (which clearly weren’t considered in this project until it was finished! Sure, it’s cute engineering, but unless the visualization is built around a well-articulated task with appropriate visual design considerations, it’s likely useless. See Munzner, T. (2009). A nested model for visualization design and validation. IEEE transactions on visualization and computer graphics, 15(6), 921–8. doi:10.1109/TVCG.2009.111).
A more perceptually accessible 2D map could be created with the same data in a couple hours in a program like Tableau Public (which is free).
It’s more about developing the conceptual math than satisfying arcane concepts of 3D. Being able to input complex and unbounded data sets to refine analysis is the end goal.
In response to your comment, I am the student lead developer for Missouri S&T’s V4DiR project, and I’d like to acknowledge as well as dispute some of the issues you raise. First, I agree that claims of 3D are widely overused today, especially in commercial aspects (Not every new movie has to have a 3D version). However when it comes to researcher’s data, we don’t presume to know what method of visualization will be helpful for them in boosting and clarifying their research. The paper you reference makes mention of two definitions of “task”; one being a very broad view and the other more narrow and refined. V4DiR was designed, knowing full well that there is a need for both of these, and so it allows researchers to first get a grasp on what they’re looking at by giving them a broad view of the scope of all their data. Then, once they see something (or in the case of a future V4DiR release, something is detected for them) that would benefit the research they are hoping to accomplish, then they can home in on the specifics and begin the more narrow version of their “task”. In the referenced IEEE paper it is also clearly stated that projects like this often have four shortcomings (wrong problem, wrong abstraction, wrong encoding/interaction, wrong algorithm). V4DiR hopes to overcome all of these problems. Without this becoming a big list I’ll post a broad view of how we address these issues. First, by being highly extensible V4DiR allows a researcher to manipulate their data and filter it to get the results they need, so while they may not utilize every feature we offer, chances are one of them will help the researcher learn something that would have taken much longer to discover without our visualization tool. We have also written and revised our system and are continuing to evaluate its performance to make sure it is as quick and efficient as it can be, while still maintaining all its usefulness. As an example, an average size dataset of about 300,000 dataponts takes an average of two to five seconds to convert. A dataset of larger scale (in the several million datapoint range) converts in about the same time it would take to copy the raw data file to a flashdrive. Regarding your assertion that the researchers needs were not considered until the project was finished, I’m not sure where you derived this information, but it simply isn’t true. This project actually began because of a researcher’s needs and has grown into a continuous development effort since then. To wrap up, for some research, 3D isn’t a necessity, but the features provided by V4DiR can still prove useful to a researcher. V4DiR can also be useful in a 2D capacity and any researcher is welcome to use it in that regard. A researcher may choose to use a program like Excel or Tableau Public to view their data, but they simply cannot get the same experience as is available with V4DiR.
In your opinion, does the possibility exist that V4DiR adds value when displaying graph data? I am a PhD student at S&T doing research in automated ontology learning and semantic search, and am looking for an innovative paradigm for viewing graph-based data. In addition to simply displaying an ontology in graph form, this would include an innovative approach to presenting search results that leverages the relationships in the ontology to help the user make sense out of results (rather than just dumping a list of related content aka Google). What I’d like to do is have the ability to provide the user with a “learning roadmap”, that is, a way to drill down into details and learn a subject from broad concepts down into important details. The ontology would provide the relationships, and I need an innovative way to present the results. Facebook is pursuing a graph-based results display. I’d be interested in your thoughts on potential use of V4DiR.
V4DiR is largely focused on presenting data in a different way than charts and so on. I’m a little vague on exactly what you want to see, but a couple of things come to mind. First, for drilling down into detailed information, it sounds like a dynamic visual index is what you are seeking. The back end code for such a system was developed some years ago (and is now most likely lost) as an experiment. To see a pre-programmed visual index, look at braintrax.mst.edu and explore the algebra materials located there.
In a larger sense, V4DiR’s capability is oriented toward maximizing a human’s innate ability to identify visual pattern anomalies. In this regard, and especially since you are already located at S&T, I suggest that you bring a sample of data, and your current analysis tools, to a consultative meeting with some of the V4DiR team. There is no charge to explore your data and see what V4DiR can do with it, and you might give us some idea of additional functionality that we should incorporate into the V4DiR transformer software, which pre-processes the data based on researcher inputs. You can reach me here, markb@mst.edu, to set up a meeting if you wish.